a grid, or a full data layer
One Data Grid, Every Live View: Board, Gantt, Charts
The grid you need today. The data layer you need next. Drop in a fast, editable grid with nothing else to install. When one feed has to drive a whole screen, the same grid becomes the front of a live data layer: grids, boards, charts and tiles fed from one connection.
Zero dependencies. Governed edits. AI you can trust, built in.
A live cloud estate: cells flash as the feed lands, the sparklines fill from a history the grid keeps, and two services sit in the red, flagged by a rule that names no threshold, only “the outliers”. Filter or sort, and the three charts above follow.
start in your stack
Start in the framework you already work in.
Open a running example in your framework and copy the starter straight into your own page, or follow the Python tutorial step by step.
two ways to use it
A grid when that is all you need. A full data layer when it is not.
Start with a grid
Point createGrid at an element and some rows, the way the grid above was made.
Sorting, filtering, grouping, editing, totals and export come with it, in one file with no
dependencies. For many teams that is the whole product, and it stays that simple.
const grid = LatticeGrid.createGrid(el, { columns, rows });Grow into a data layer
When one feed has to drive a whole screen, add the data router. It takes the stream, decides what each record is, and keeps every grid, board and tile fed from one connection: orders to one grid, shipments to another, a third grid summarising the second, a board by region, tiles totalling it all, and a record that matches nothing counted, not lost. The picture below is that router, running.
The router API →order shipment incident, no route, counted as unrouted
what sets it apart
From a simple grid to interactive dashboards, with easy configuration and AI operation.
A grid is where you start, not where it stops. The same feed drives a board, a schedule, charts and KPI tiles at once, every edit passes a gate you control, and asking your data in plain English is part of the grid, not a bolt-on.
Data Router
Point one live feed at a whole screen. Partition the stream by what each record is, and every grid and chart fills with only its own slice, with no connection per panel.
Live views
The same rows read as a board, a project plan and a panel of KPI tiles, not only a table. Move a card, drag a bar or watch a figure, all driven by the one dataset.
Datasets too big to send
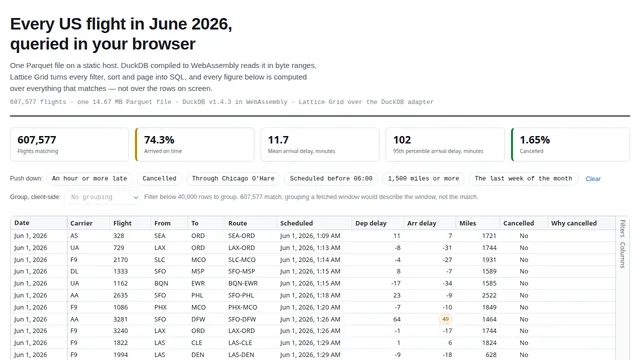
Put a grid over DuckDB, a Parquet file or your warehouse. Filtering, sorting and paging become one query answered where the data lives, and only the rows on screen come back.
Statistics
Medians, percentiles, spread and a forecast, recomputed over exactly the rows you are looking at. Filter the grid and every figure follows, with nothing fetched at runtime.
Governed edits
Every change passes a gate you control. Veto an edit or a delete before it lands, gate writes behind your own checks, and undo any of it in one step.
AI, built in
Reshape the view from a plain-English request, or read a plain-language summary grounded in the grid's own figures. Your model, your key: the grid makes no AI call of its own.
No framework and zero dependencies, so it behaves the same in React, Vue, Svelte, Angular or a plain HTML page, and it is priced per domain, not per developer.
one feed, many live views
One live feed drives a whole screen of linked views.
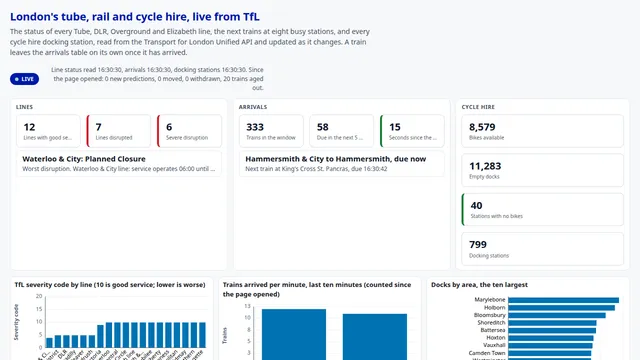
An operations console is never one table. Orders, shipments and incidents land on a single stream, and the wall needs a grid for each with a throughput line along the bottom. Point one router at the feed, partition it by what each record is, and every grid and chart fills itself with only its own slice, live. Pick a run of rows in one grid and a linked view narrows to the matching rows. No connection per panel, and no one giant grid sliced to death.
See the realtime layer → Build a network operations centre → Build the ops console →
getting started
Get up and running in about a minute
Drop one stylesheet and one script from a CDN into your page, point it at a div with a height, describe your columns. Columns group their settings by concern, so a column definition reads as a description of the column rather than a list of forty flat properties.
That is the whole file. There is no build step, no configuration file and nothing to
register at start-up, and the grid takes no runtime dependencies of its own. If you would
rather install it, the same build is on npm as
@toclocoinc/lattice-grid, and the type declarations travel
with it.
Using Lattice Grid, free or licensed, means accepting the licence terms.
Everything below is already on, without asking for it:
- Sorting, including shift-click for a second key
- A filter on every column, matched to what the column holds
- Resizing, reordering and hiding, by dragging the heading
- Keyboard navigation, with the grid as one tab stop
Development on localhost needs no licence key, so you can build the real screen against real data before deciding anything.
<!-- one stylesheet and one script, straight from a CDN -->
<link rel="stylesheet" href="https://cdn.jsdelivr.net/npm/@toclocoinc/lattice-grid@1.76.0/lattice-grid.min.css">
<script src="https://cdn.jsdelivr.net/npm/@toclocoinc/lattice-grid@1.76.0/lattice-grid.min.js"></script>

// then, on your own page, no build step:
const rows = [
  { id: 1, circuit: 'ETH-LON-100001', region: 'London',
    status: 'live', bandwidth: 1000, charge: 465.32 },
  // ...one object per row
];

const grid = LatticeGrid.createGrid(el, {
  rows,
  rowKey: 'id',
  selection: 'multiple',
  columns: [
    { field: 'circuit', title: 'Circuit',
      layout: { pin: 'start', width: 190 } },
    { field: 'region', title: 'Region',
      group: true, filter: { type: 'set' } },
    { field: 'status', title: 'Status',
      filter: { type: 'set' } },
    { field: 'bandwidth', title: 'Bandwidth',
      type: 'number', format: { style: 'decimal' },
      filter: { type: 'number' } },
    { field: 'charge', title: 'Monthly charge',
      type: 'number',
      format: { style: 'currency', currency: 'GBP' },
      total: 'sum',
      filter: { type: 'number' } }
  ]
});
not a read-only viewer
Made to be edited, not just read.
A read-only grid shows the data. This one changes it. Editing is not a paid add-on or a second component wrapped around the table: inline edits, drag-to-fill, paste straight from Excel, edits across a whole selection at once, validation that refuses a bad value before it lands, and one undo stack over all of it, standard in the box. The same section covers the live tools that go with working in a grid rather than reading one: redact a column before a screen share, draw over it to make a point, and throw it full screen. Double-click a cell below and type, or send the grid full screen and watch it mark up a couple of cells for you.
-
Inline editing
Double-click, a keystroke, or Enter opens the editor over the cell. Tab and Enter commit and move on, Escape restores what was there.
-
Fill handle
Drag the corner of a selection to extend a series: repeat a value, continue 1, 2, 3, or advance a run of dates, the way a spreadsheet user expects.
-
Copy and paste
Tab-separated on the way out and back in, so a range copies into Excel or Sheets as real columns and a block pastes back through each column's parser.
-
Bulk edits
Apply one value across a whole selected range in a single write, and reverse all of it with one undo rather than one per cell touched.
-
Validation
A per-column rule refuses a bad value on commit: the editor stays open, the cell shows why, and the value never reaches the row.
-
Undo and redo
One history stack over every kind of write. A typed cell, a fill and a paste each land as one entry, so undo reverses the gesture, not the cells.
-
Row editing
Edit the whole row at once and commit it as a unit, for the workflow where a record is corrected field by field before it is saved.
-
Editor gallery
Twenty-two editors, from number steppers and date pickers to sliders, colour swatches and a code editor, each wired to the column type it belongs to.
-
Redaction
Mask a column before a screen share. The row count, the sort and the filters stay readable; only the values it holds go dark, and one click brings them back.
-
Annotations
Draw over the grid to mark a column, circle an outlier or underline a total. Marks are held in content coordinates, so they travel with the cells as you scroll.
-
Full screen
Fill the window with the grid and come back to the same scroll position and the same selection, one key each way. The grid below marks up a couple of cells when it goes full screen.
typed to the column
Engineering data, parsed into real types.
Point a column at a built-in type and it parses what a person types rather than storing the
text of it. Here every column on a bench of lab instruments is a different type:
1.5 TB becomes a byte count, 3h 20m
becomes a duration, 10.0.0.42 becomes a 32-bit address, a
subsystem code becomes its label. Each one then sorts, filters, totals and exports on the
parsed value, not on the string on screen. Double-click a cell and try one.
-
Built-in types
One
typeper column decides its comparator, its alignment, the filter it offers and the editor it opens, from a single declared line. -
Units
A column that means bytes, metres or bits per second accepts
1.5 GBor40 km, stores one base value, and renders each row in the unit that reads best. -
Durations
Elapsed time stored as a number and shown as
3h 12m, so a duration column sorts by true length rather than alphabetically. -
Numbers and currency
Grouping, fixed decimals, currency symbols and parenthesised negatives, applied at render only, with the underlying number left untouched for sorting.
-
IP addresses
An
ipv4column stores a 32-bit integer, so addresses sort in true numeric order and cross 128.0.0.0 correctly rather than lexically. -
Dates and zones
One instant, formatted per column against a named time zone, while sorting and filtering compare the underlying moment across every zone shown.
-
Hex, binary and octal
One integer read in more than one base at once. Editing any base parses in that base and writes back the same number, so the others re-render.
-
JSON values
A nested object held whole in a cell, with individual leaves lifted into real sortable, filterable columns beside it.
for the people who live in it
The screen they use all day.
Most of what an operations team asks a grid for has nothing to do with rendering rows. It is the small things around the data: getting it on a projector, sharing a screen without showing a salary, coming back to the view they had yesterday. All of this ships in the box, so nobody has to build it twice.
Reviewing the numbers happens on the same screen the numbers live on. A thread hangs off a cell with the questions still open counted next to it, and anyone can draw straight onto the grid to point at the row under discussion.
-
Presentation mode
Scale the whole grid up for a room, step through saved views like slides, and spotlight the rows you are talking about. The data stays live and interactive throughout.
-
Saved views
Name a set of columns, filters, sorting and grouping, and switch between them. The view someone built on Monday is still there on Friday.
-
Cell comments
Threaded discussion attached to a cell, with an unresolved count, so reviewing data happens in the grid rather than in a separate thread nobody can find.
-
Four themes
Light, dark, high contrast and terminal, switched live. High contrast is built to the WCAG boundary rules rather than being dark with the brightness turned up.
-
Excel export
A styled workbook with number formats and frozen panes, written by the grid itself. No server round trip, and no extra dependency in your bundle.
-
Keyboard throughout
The grid is one tab stop, so it never traps anyone. Arrows, page keys and Enter do what a person coming from a spreadsheet expects.
nothing fails silently
A wrong setting tells you it is wrong.
Hand the grid a value it cannot use and it no longer falls back without a word. It names the setting, says what it expected, shows the value it got, and keeps rendering on the safe default. A mistyped option or a value pasted from the wrong place surfaces while you build it, not weeks later when someone asks why a colour never took. A value the grid understands stays silent, so a warning is always worth reading.
answers, not just rows
The grid that shows you what the data says.
A table hands you the numbers and leaves the reading to you. This one does the reading too: it draws from its own data, tells you what the figures mean, and remembers how they have moved since you opened the page. The grid below is doing all three, right now.
- median latency
- …
Every figure is read back from the grid’s own statistics engine over these exact rows.
The busier a node runs, the slower it answers. The chart plots it straight from the grid, with a fitted line.
-
Charts
Thirty-five chart types drawn straight from the grid's own rows. Filter the grid and every chart follows, no export, no second data set, nothing fetched at runtime.
-
Statistics
A median, a 95th percentile or a deviation in the totals row, and a full column profile in a panel, every figure recomputed over exactly the rows you are looking at.
-
Shadow columns
Columns that track what changed since you arrived: delta, times moved, rank and places climbed. Sort by places moved and you have a live top-movers view in one click.
public data, public code
Built with it, in the open
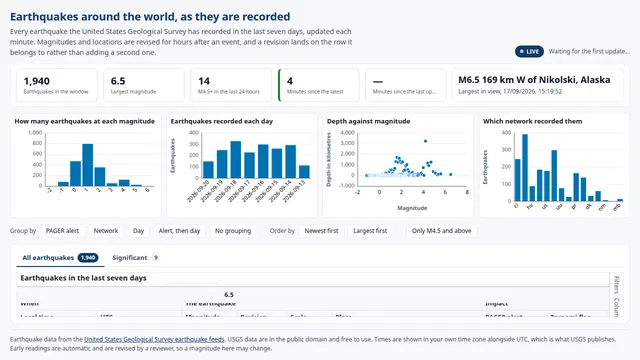
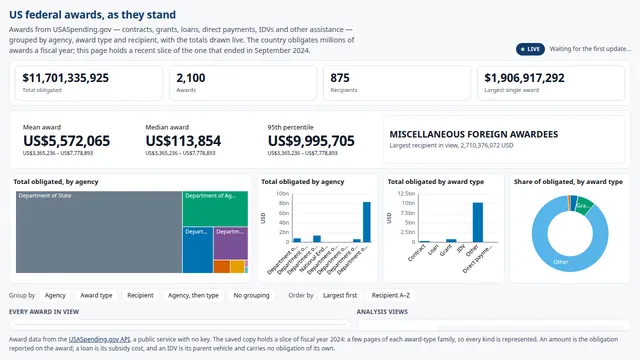
Nine dashboards on real public data, each one a page you can open and a repository you can read. Open one, put it under load, then take the code and start from it.
-
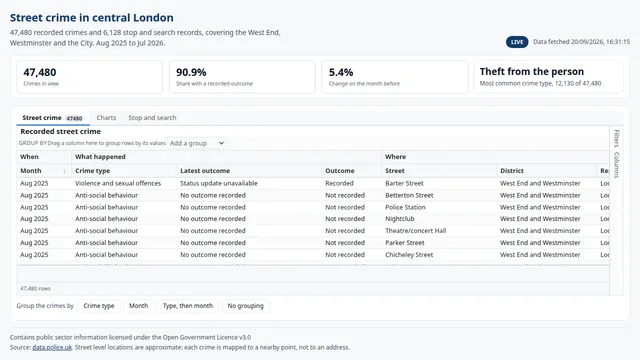
Street crime in central London
Public data that arrives a month at a time, with the table, the headline figures and the charts all moving as each month lands and nothing drawn twice.
Twelve months of central London, tens of thousands of records, first rows on screen in under half a second
-
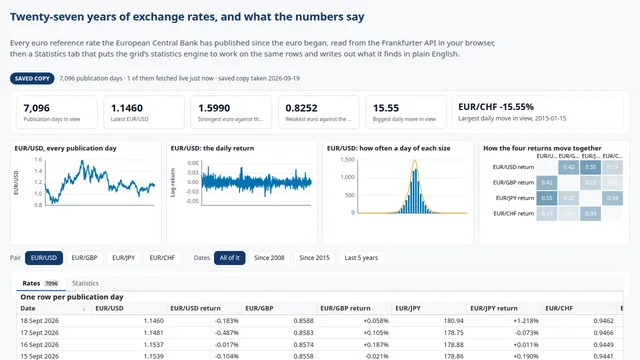
Exchange rates since the euro began
Ask the rows what they say. Volatility, fat tails, stationarity and control charts are computed over exactly the days in view, and rewritten the moment you narrow them.
7,094 working days of European Central Bank rates, the whole history analysed in under two seconds
-
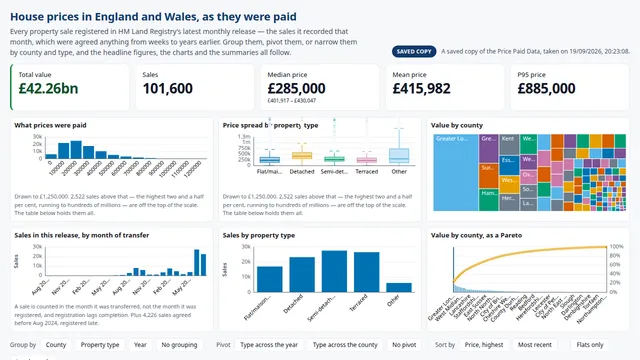
House sales, nationwide
Every property sale in the latest national release, grouped and pivoted by county, property type and year, with rank, percentile and share of value on every row, and the medians moving the moment you narrow the table.
101,600 sales from HM Land Registry’s latest monthly release, queryable in the browser as a 3.1 MB Parquet file
-
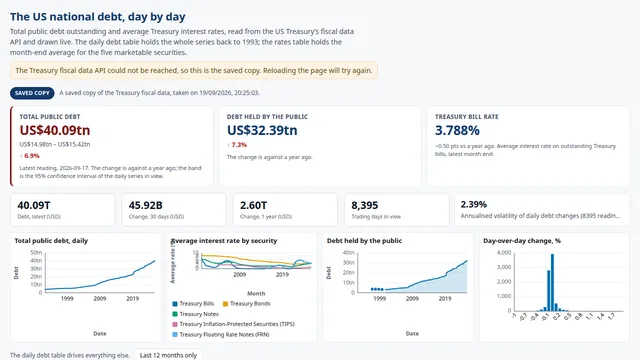
The US national debt, tracked daily
Thirty-three years of the US Treasury’s own daily debt figures, with the day-on-day change, a rolling average and a volatility profile that stay current as new readings arrive.
8,395 daily readings back to 1993, polled live from the Treasury’s own fiscal-data API
the licence maths
What a grid actually costs your team.
Per-developer licensing charges you for headcount you already pay for. Move the sliders and see the difference over one year.
typical per-developer licence
$15,000
Charged per seat. Renew every year to keep receiving updates. Contractors and agency developers each need their own.
lattice grid, per domain
$1,000
Charged per domain the grid is served from. Unlimited developers, contractors and build agents. Updates included for the term.
See how this compares to AG Grid → · and to MUI X, Handsontable and TanStack →
one edition
Free to build with. Licensed to ship.
There is one Lattice Grid and it is the complete one. No feature is held back for a bigger licence: a wildcard covers more subdomains, never more grid, so what you evaluate on your laptop is exactly what you deploy. Every feature named anywhere on this site is in all three below; what a licence buys is where the grid may run, not what it can do.
development
Free on localhost, watermarked, no key
- The whole grid, nothing withheld
- Watermarked until you license a hostname, and that's the only difference
- No time limit and no countdown
- Build the real screen against real data
- Run it in your test suite, in CI, on staging, all free, all watermarked
- No sales call attached
deployment
$1,000 per domain with one year of support
- Unlimited developers, contractors and build agents
- Direct support from the engineers who built it, and bug reports never count
- No watermark, on every domain you name
- Renew for support, or don't. The version you paid for keeps working on your domains, forever.
wildcard
$10,000 one wildcard domain with one year of support
- For a SaaS with a subdomain per customer, or estates too large to name
- Every subdomain of one domain, at any depth, and
example.comitself - One registrable domain.
example.co.ukis a separate licence. - The same complete grid: more reach, not more features
- Priced at ten named domains, with no ceiling on subdomains
What counts as a domain
A domain is the hostname the grid is served from.
- Every hostname is its own domain.
example.comandwww.example.comare two. app.example.comis another. So isadmin.example.com.example.comandexample.co.ukare separate domains.- Ports and paths don't count.
app.example.com:8443/adminis the same domain asapp.example.com. - Serving from an internal hostname or an IP address? That's a domain too.
Localhost, CI, staging and preview branches run free, with the watermark. Only a licensed hostname clears it.
More than two or three hostnames? Take the wildcard.