showcase
Showcase: Live JavaScript Data Grid Demos
33 whole applications, each built on Lattice Grid over a real public dataset: government open data, live weather and transport feeds, financial and scientific statistics. Every one runs live on GitHub Pages, or as a desktop app you build from source, with its full source in its own repository. Not a feature in isolation, the way a demo on this site's own demos page is, but a small, real application you can read start to finish.
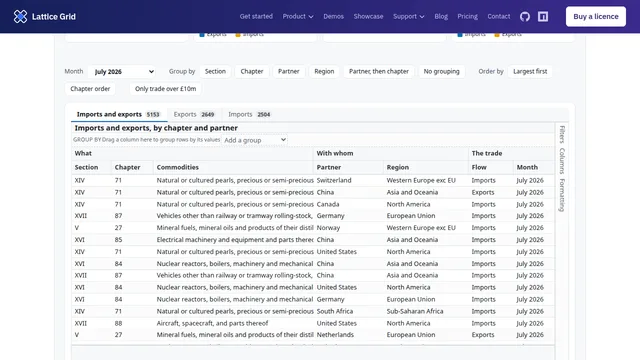
UK Trade Dashboard: Data Router, Derived Grids and Bound Charts
One month of HMRC trade figures through a data router, driving a table, two tabs, five KPI tiles and four charts together, live on this site.
Data: HM Revenue and Customs, uktradeinfo, via the GitHub demo’s nightly saved copy

Dashboard builder over orders, products and customers
The Lattice Designer in plain JavaScript over three related tables: a revenue tile, charts, grids, a top customers grid derived from the orders, edit and view modes, and save and load.
Data: Generated retail sample data, shipped in the repository
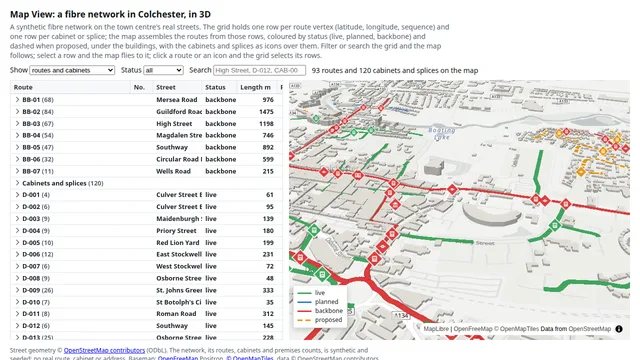
Fibre network map in 3D: Colchester
A fibre network on Colchester’s real streets, drawn in 3D by Map View from the grid’s own rows: routes built from latitude and longitude rows, coloured by status with proposed routes dashed, cabinets and splice points as icons above the buildings. Filter or search the grid and the map follows; click a route and the grid selects its rows.
Data: OpenStreetMap streets (ODbL) with a synthetic, seeded fibre network
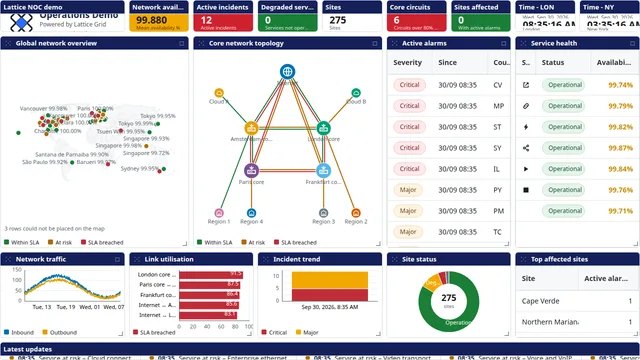
Network operations centre
A rearrangeable NOC wall: sites by SLA on a map, core topology, alarms, service health and KPIs, all viewers of one data router feed.
Data: RIPE RIS, IODA and PeeringDB, recorded for replay
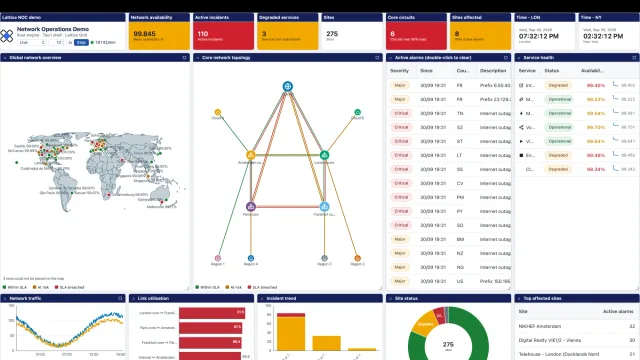
Network operations centre, desktop
The same NOC wall as a native desktop app, about 1,600 lines of Rust building and moving the network and feeding it straight into the grid’s own data router, with nothing loaded over the web.
Data: A simulated network of sites, circuits, alarms and traffic, generated by the Rust engine

Content calendar
One Data Router feed, three views of the same posts: a grid, a kanban board and a calendar. Drag a post to another day and every view follows.
Data: Synthetic social posts, generated in the page
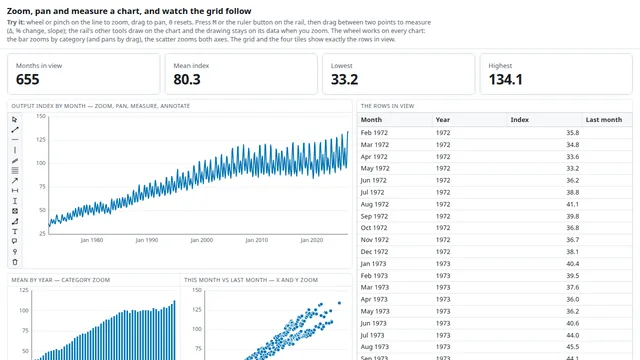
Zoom, measure and annotate a chart
Zoom and pan a chart, measure a move between two points, draw on it, and watch the grid narrow to the rows in view.
Data: FRED, Federal Reserve Bank of St. Louis: electric power generation index
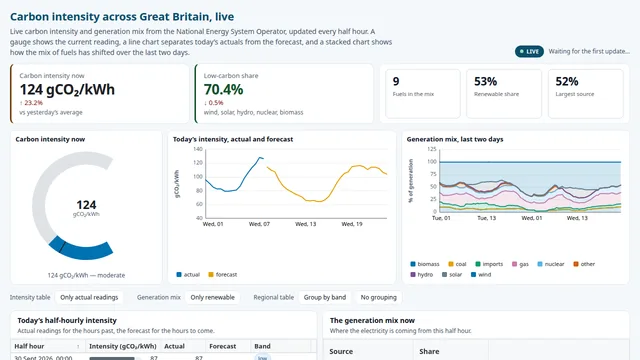
Great Britain carbon intensity
A live gauge, a forecast-vs-actual chart and a stacked generation mix, updating as the grid reports.
Data: National Energy System Operator (NESO) carbon intensity API
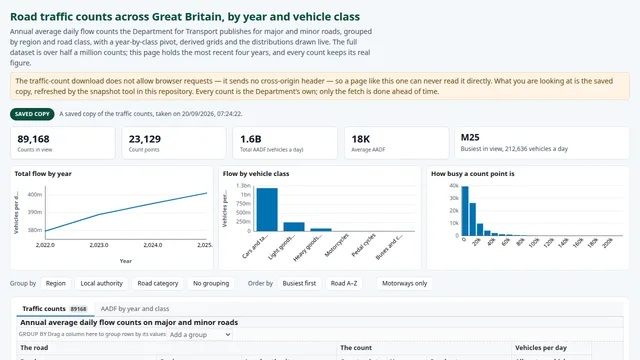
UK road traffic counts
Road traffic counts across Great Britain, filtered and grouped by road and vehicle type.
Data: UK Department for Transport (DfT) road traffic statistics
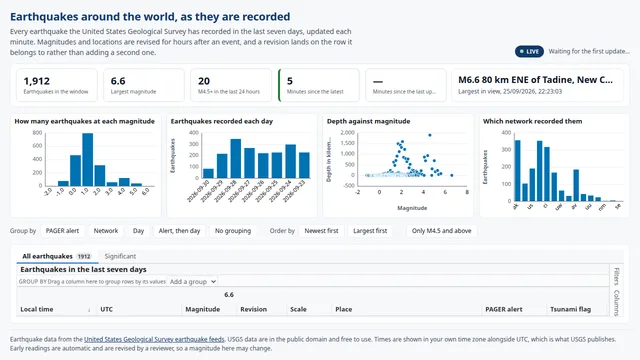
Worldwide earthquakes, plain JavaScript
Every earthquake recorded worldwide in a rolling window, no build step at all.
Data: United States Geological Survey (USGS) earthquake feed
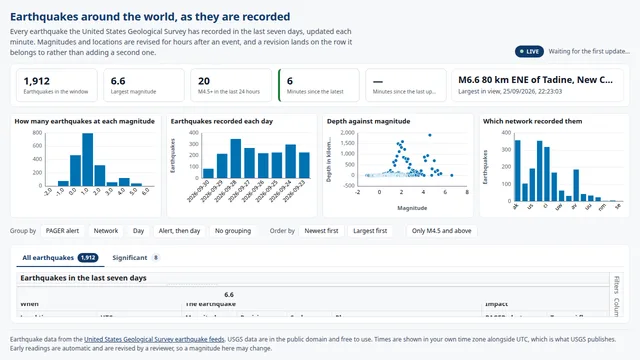
Worldwide earthquakes, as a React app
The same worldwide earthquake dashboard, built as a React application with the shipped React adapter.
Data: United States Geological Survey (USGS) earthquake feed
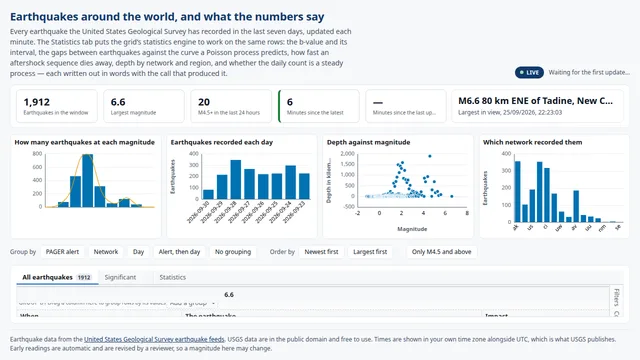
Earthquake magnitude and aftershock statistics
Magnitude-frequency fit, inter-arrival distribution, aftershock decay, depth distribution and a daily-count control chart, all from the grid’s own statistics engine.
Data: United States Geological Survey (USGS) earthquake feed
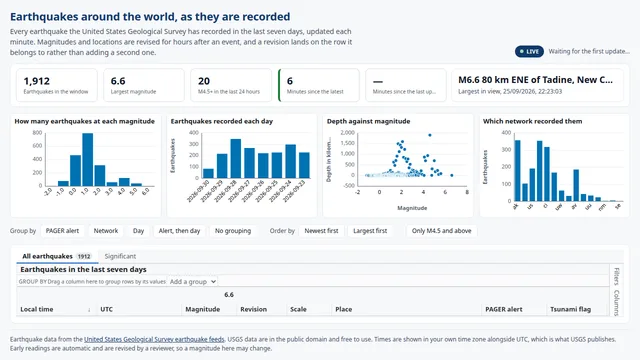
Worldwide earthquakes, loaded from a CDN
The worldwide earthquake dashboard with the grid loaded straight from the CDN as script tags.
Data: United States Geological Survey (USGS) earthquake feed
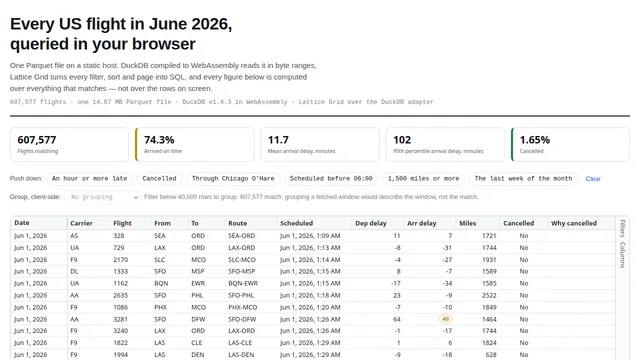
US flight delays over a 14.67 MB Parquet file
607,577 flights queried in place with DuckDB-Wasm and byte-range reads: no server, no API, no pre-built cube.
Data: US Bureau of Transportation Statistics, On-Time Performance data
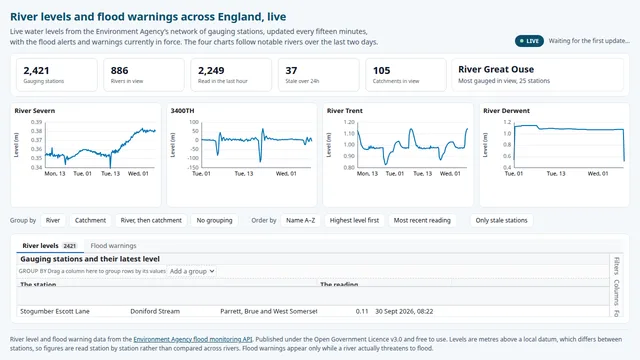
UK river levels and flood warnings
Live river levels and flood warnings, fanned through the Data Router to a grid and matching charts.
Data: UK Environment Agency real-time flood-monitoring API
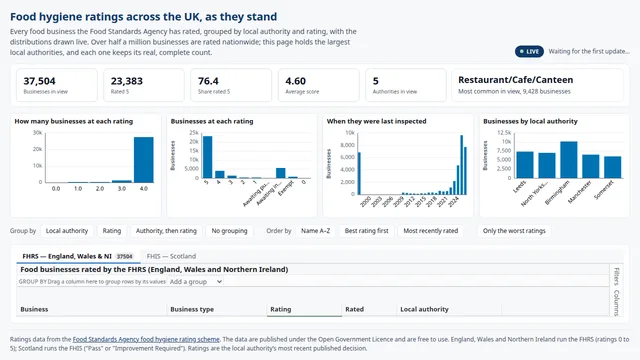
UK food hygiene ratings
Food Hygiene Rating Scheme inspections, grouped and routed live to a grid and charts.
Data: UK Food Standards Agency Food Hygiene Rating Scheme (FHRS) API
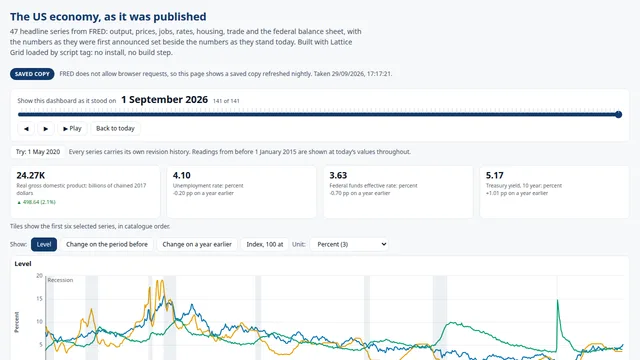
US economic data with vintages
US economic series with vintages: what a figure said the day it was first published, not only what it says now.
Data: Federal Reserve Economic Data (FRED / ALFRED), Federal Reserve Bank of St. Louis
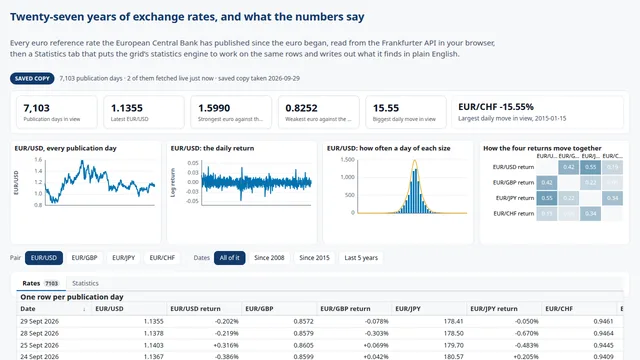
Currency returns and volatility
Currency returns topped up live through the Data Router: log returns, volatility, fat tails, stationarity and control charts.
Data: European Central Bank reference rates, via the Frankfurter API
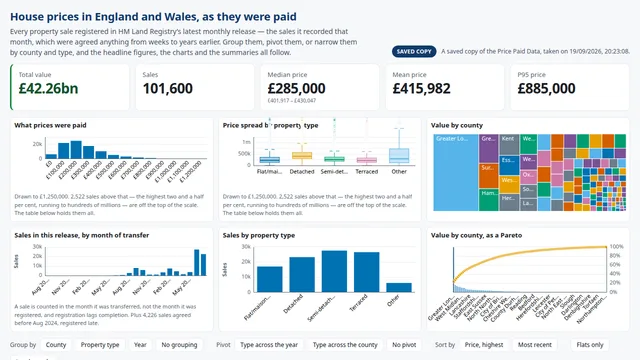
UK house prices, loaded from a CDN
HM Land Registry’s Price Paid Data for England and Wales, with the grid loaded from the CDN as script tags.
Data: HM Land Registry Price Paid Data
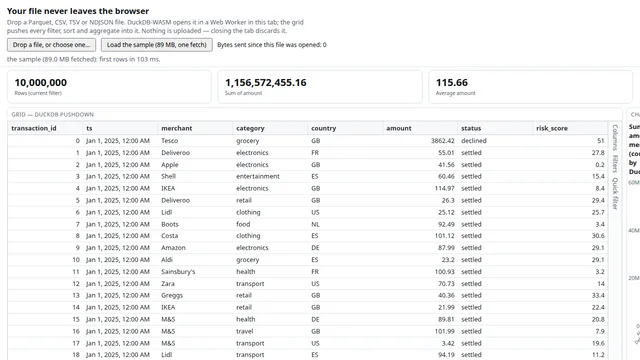
Your file never leaves the browser
Drop a Parquet, CSV, TSV or NDJSON file and the grid, its KPI strip, chart, map and statistics panel run against it entirely inside DuckDB-WASM, in a Web Worker in the tab; a live readout shows zero bytes sent for the dropped file.
Data: A dropped local file, or a seeded 10 million-row sample
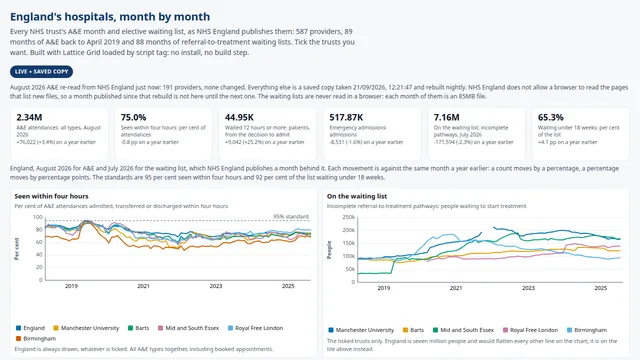
NHS England A&E and waiting lists
A&E performance and waiting-list statistics by NHS trust.
Data: NHS England statistical publications
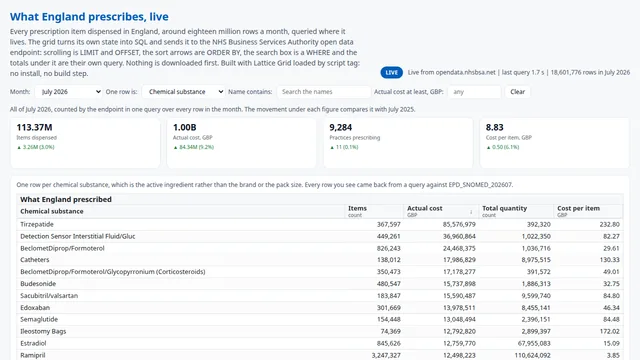
English prescribing data, queried live
English prescribing data queried live from an open data SQL endpoint, not a downloaded extract.
Data: NHS Business Services Authority (NHSBSA) open data portal
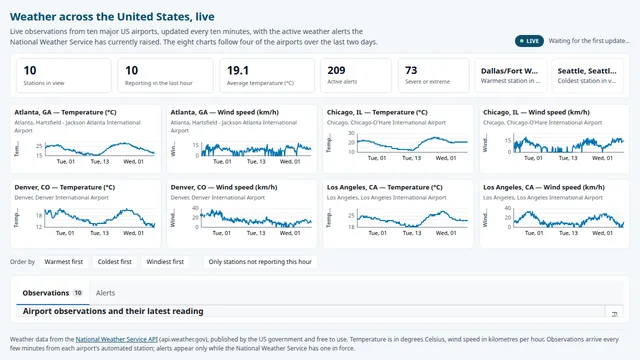
US weather observations and alerts
Live weather observations and active alerts across the United States.
Data: US National Weather Service (NWS) API
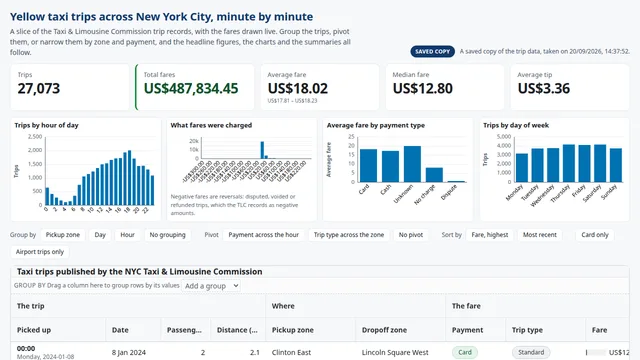
NYC taxi trip records
New York City taxi trip records queried in place through DuckDB-Wasm.
Data: NYC Taxi and Limousine Commission (TLC) trip record data
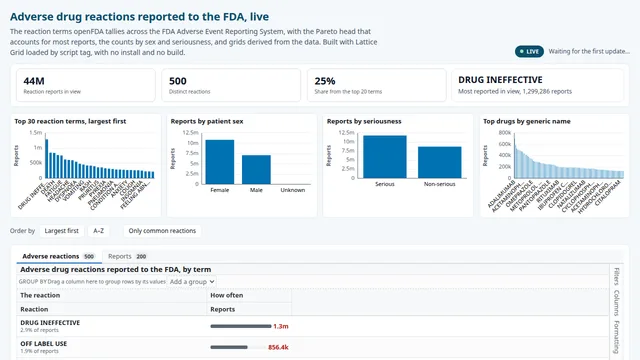
FDA adverse drug reaction reports
Adverse drug reactions reported to the FDA, live.
Data: US Food and Drug Administration, openFDA API
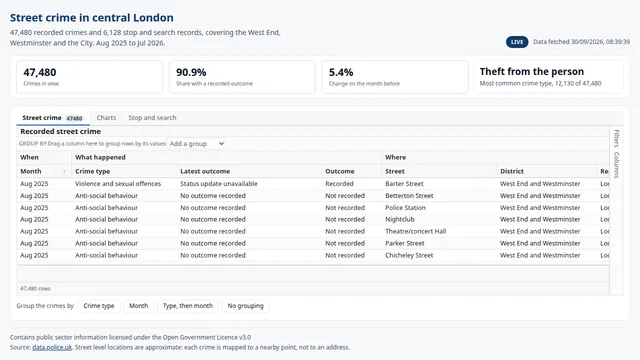
UK street-level crime data
Street-level crime data routed live to a grid, map tiles and charts.
Data: data.police.uk, UK Home Office
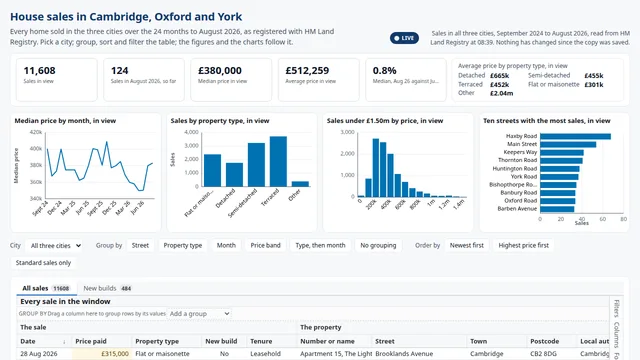
UK house prices, plain JavaScript
HM Land Registry’s Price Paid Data for England and Wales, in a plain JavaScript dashboard with no build step.
Data: HM Land Registry Price Paid Data
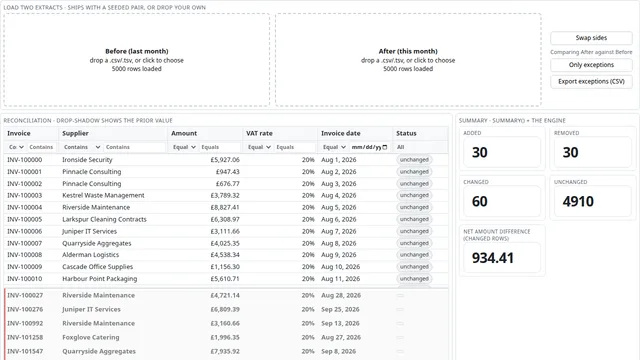
Reconcile two extracts
Drop last month’s and this month’s extract and the grid’s diff (audit mode) shows every row added, removed or changed, the prior value on hover, summary tiles, a swap and an export of just the exceptions.
Data: Synthetic seeded supplier-invoice extracts, generated by this repository’s own script
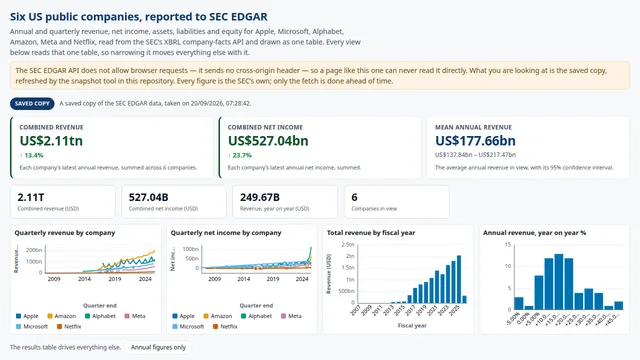
SEC company facts
Company financial facts as filed with the SEC.
Data: US Securities and Exchange Commission, EDGAR company facts API
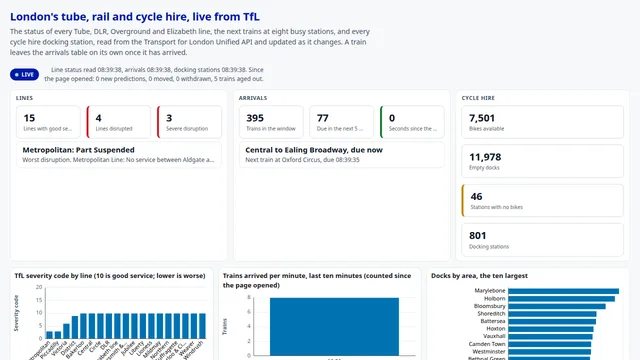
Live London transport status
Live London Underground line status and arrivals, streamed through the Data Router.
Data: Transport for London (TfL) Unified API
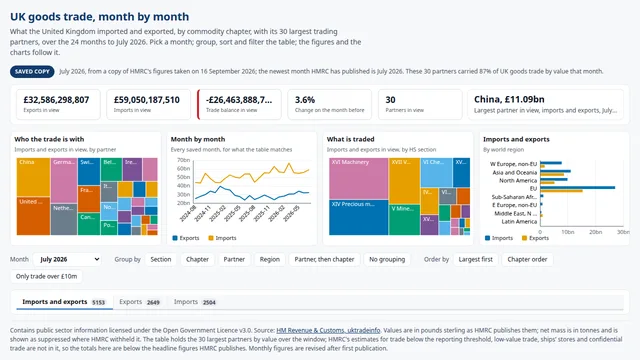
UK trade statistics
UK trade statistics as a script-tag dashboard: no npm install, no build step.
Data: HMRC uktradeinfo OData API
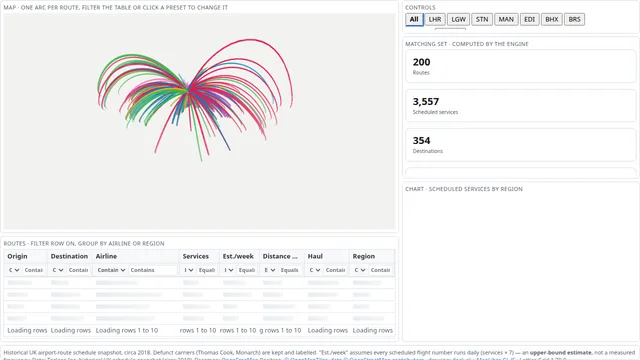
UK flight routes
1,621 routes from seven UK airports as deck.gl arcs on a map, filtered and coloured from the same grid that lists them; a historical snapshot, not live traffic.
Data: A historical snapshot of UK airport route data
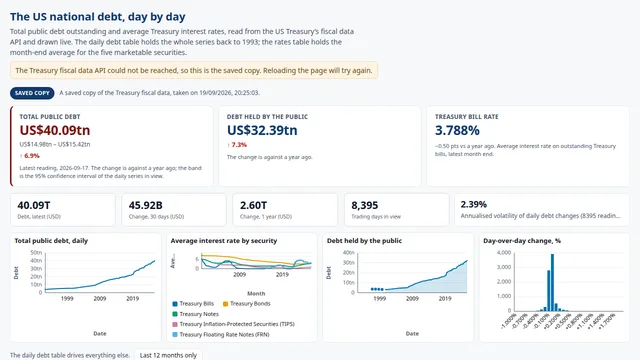
US Treasury fiscal data
US federal fiscal data: debt, spending and revenue over time.
Data: US Treasury Fiscal Data API

US federal spending awards
US federal contract, grant and loan awards.
Data: USAspending.gov API, US Department of the Treasury